Data Visualization Consulting & Services
We design and build custom data visualizations, dashboards, and reports through our data visualization consulting services that turn complex business data into clear, actionable insights your leadership team will actually use.
How it works
Data Visualization Consulting
Helping Leaders See What Matters Most
Discovery & Requirements
Our data visualization consulting process starts by meeting with your team to understand your data sources, audience, and the business decisions your visualizations need to support.
Initial Development
As part of our data visualization consulting services, we deliver your first custom dashboard or visualization within 30 days. We build in Power BI, Tableau, or your preferred platform using your actual data from day one.
Iterate & Management
With continued data visualization consulting, we refine dashboards, expand reporting capabilities, and help your analytics environment scale alongside your business.
Data Visualization Consulting to Unlock Clearer Business Decisions
Data visualization consulting bridges the gap between raw business data and the decisions your leadership team needs to make. At Brewster Consulting Group, our data visualization services help organizations move beyond spreadsheets and manual reports for good.
We build custom dashboards, interactive reports, and executive scorecards that connect directly to your source systems and refresh automatically. No more manual exports. No more spreadsheets sent by email. No more waiting days for a report that answers yesterday's question.
Our data visualization consultants embed into your team as fractional analytics managers, meaning we do not just hand off a dashboard and disappear. We manage, iterate, and evolve your data visualization environment as your business changes.
What you get with our Data Visualization Consulting Services:
- Custom data visualizations and dashboards built around your KPIs
- Automated data workflows that eliminate manual reporting
- Fractional analytics managers embedded in your team
- Scalable data visualization environments built for long-term use
- Insights that improve profitability, efficiency, and decision-making
Case Studies
Turning Data into Clear Visual Decisions with Data Visualization Consulting
Discover how Brewster's Data Visualization Consulting services helped a consumer goods company uncover the true root cause of declining sales and build a segmented dashboard that powered an immediate strategic turnaround.
From Spreadsheets to Safety Strategy: How Data Visualization Consulting Transformed H&S Reporting for a Logistics Company
See how Brewster built a centralized Power BI Health & Safety dashboard that unified KPI tracking across dozens of facilities and shifted a national logistics company from reactive reporting to proactive risk management.
How Data Visualization Consulting Transformed Financial Reporting for a Fast-Growing SaaS Company
Learn how Brewster replaced Medefy's disconnected spreadsheets with a purpose-built Power BI dashboard that centralized SaaS financial KPIs, automated data flows, and freed the finance team to focus on strategy instead of reporting.

"The entire team at Brewster was efficient, forward-thinking, and adaptable to every pivot we made on our project. Their expertise allowed us to think in different ways and expand the end result of the project, leading to a more-than satisfactory result for our executive team."
Manager of Training & Sustainability

"It is rare that you call a random consulting company off the internet and get what you think you're going to get, but kudos to [Brewster Consulting]. You have exceeded our expectations."
Director of Operations

"Our organization was so thankful to have the opportunity to work with Brewster Consulting Group. They've transformed the way we present data to our clients in a way that sets us apart from competitors. Bringing numerous datasets together from many applications in a way that's digestible and tells a story isn't easy. They made this possible through their depth and breadth of knowledge in this space."
Senior Director, Support Center
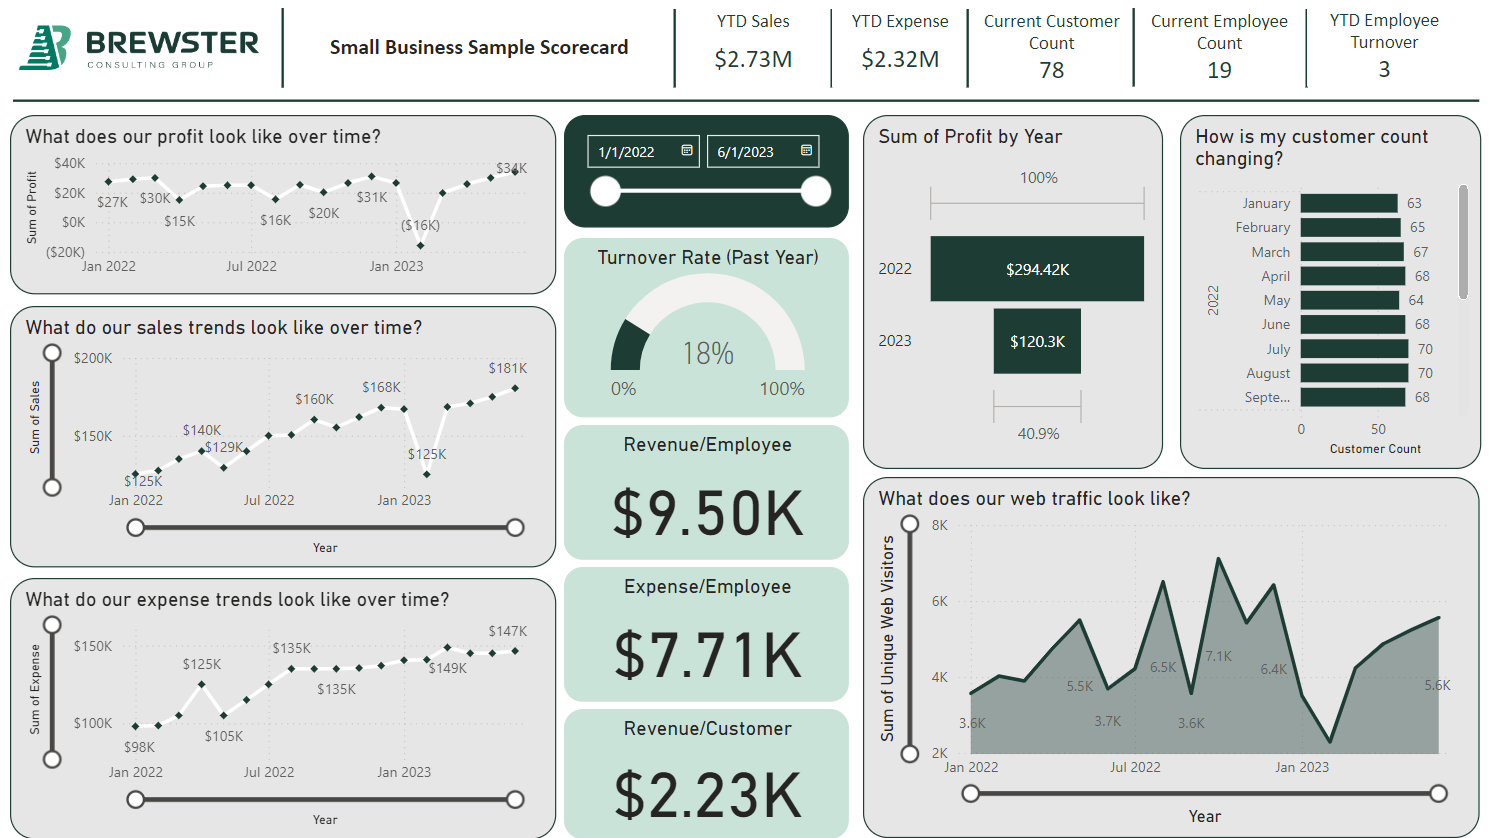
Sample Dashboards
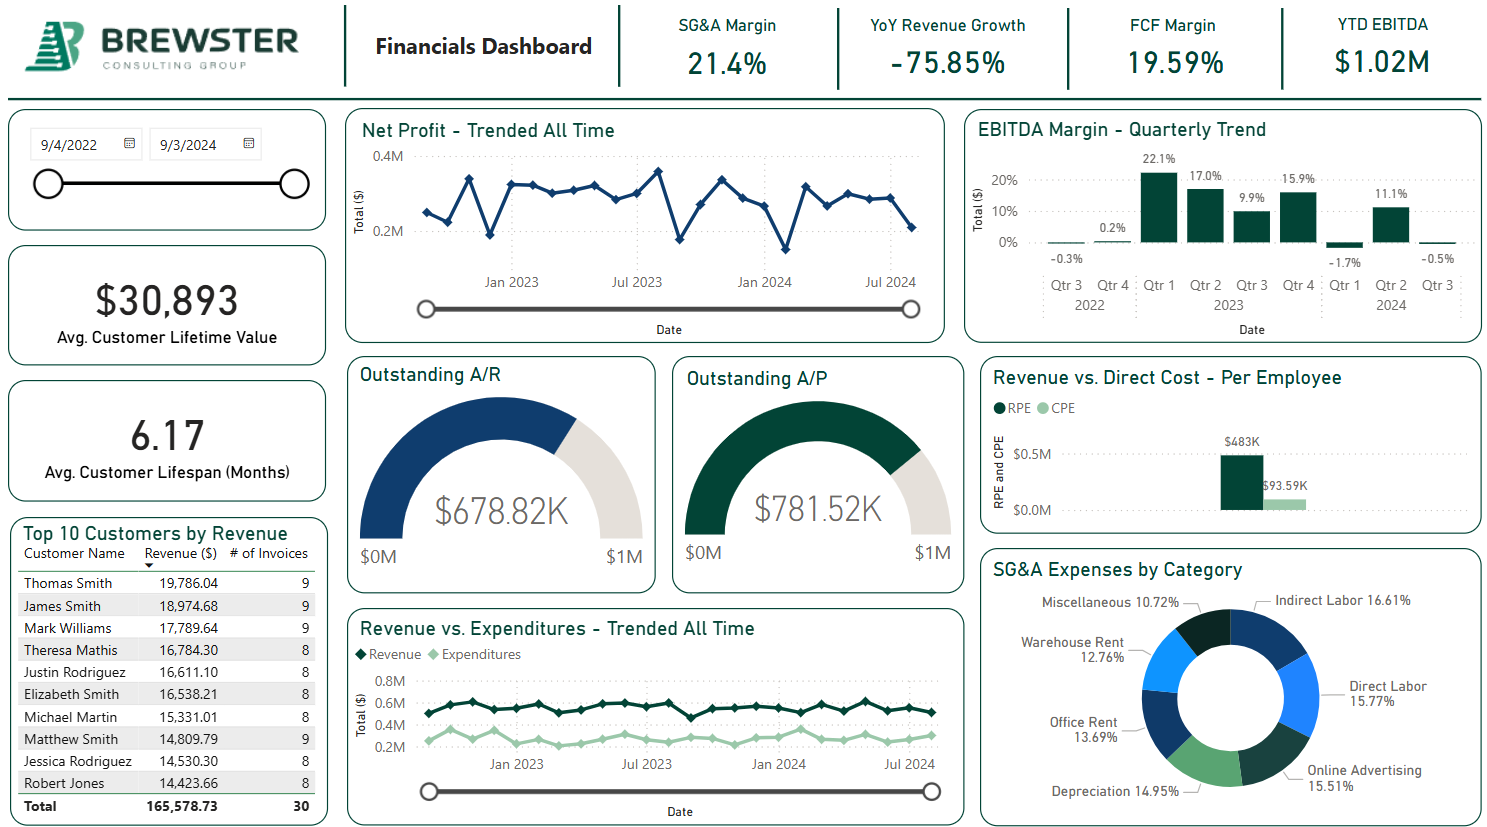
Financials
Example BI Dashboard Depicting Key Financial Metrics

Health & Safety
A Health & Safety Scorecard Presented in a BI Platform from data visualization consulting services

Manufacturing Waste
A Manufacturing Waste Dashboard Demonstrating Waste Data and Tracking OEE created through data visualization consulting services
Frequently Asked Questions About Data Visualization Consulting & Services
At Brewster Consulting Group, we are often asked about our data visualization consulting services and how they help organizations make better decisions. These FAQs cover the most common questions we receive about data visualization.
What is data visualization consulting?
Data visualization consulting is the practice of helping organizations design, build, and manage visual representations of their business data. A data visualization consultant works with your team to understand your data sources, your audience, and the decisions your reports need to support, then builds dashboards, charts, and interactive reports that make complex data easy to understand and act on. Brewster Consulting Group provides data visualization consulting services for organizations that need to move beyond spreadsheets and manual reporting into scalable, automated data visualization environments.
What data visualization tools does Brewster use?
Brewster's data visualization consultants primarily build in Microsoft Power BI and Tableau, two of the most widely used data visualization platforms for mid-market and enterprise organizations. We also work with Qlik, Looker, and native visualization layers in Snowflake and Azure. Our tool recommendation is always based on your existing technology stack, your team's familiarity, and your long-term data strategy rather than a preference for any single platform.
How long does a data visualization project take?
Most data visualization engagements deliver the first dashboard or report within 30 days. A complete data visualization environment covering multiple business areas typically takes 3 to 6 months to build, test, and refine. Ongoing iteration and management continues beyond initial delivery as your business needs evolve. Brewster operates as fractional analytics managers for most clients, meaning we stay embedded in your team to continuously improve your data visualization environment rather than handing off a static deliverable.
What is the difference between data visualization consulting and business intelligence consulting?
Data visualization consulting focuses specifically on the design and delivery of visual reports, dashboards, and charts that communicate data clearly. Business intelligence consulting is broader and includes data strategy, data warehousing, data governance, and the full infrastructure that powers reporting. At Brewster, our data visualization services are often the entry point for clients who later expand into full business intelligence consulting engagements. If you need dashboards now and a data strategy later, we can deliver both.
What does a data visualization consultant deliver?
A Brewster data visualization consultant delivers custom dashboards, interactive reports, executive scorecards, and operational reporting tools built directly on your data sources. Every deliverable is designed around the specific business decisions your leadership team needs to make, not generic templates. Deliverables typically include a connected data model, automated refresh schedules, role-based access controls, and documentation so your team can maintain and expand the environment over time.
What industries do you provide data visualization services for?
Brewster delivers data visualization consulting services across financial services, healthcare, manufacturing, oil and gas, professional services, SaaS, logistics, and construction. Even if your industry isn't on this list, it's still likely a good fit. Our approach is not industry-specific because we start every engagement by understanding your business processes and the decisions your data needs to support, regardless of your vertical. We have built data visualizations for credit unions, managed service providers, distributors, private equity-backed portfolio companies, and airports, along with dozens of other companies.
How much do data visualization consulting services cost?
Data visualization consulting engagements at Brewster are priced based on the scope of work, the number of dashboards and data sources involved, and the level of ongoing management required. Project-based engagements for a single dashboard or report suite are priced as fixed fees. Ongoing fractional analytics management is priced as a monthly retainer. Schedule a 30-minute call and we will scope your engagement and provide a fixed fee before any work begins.
How do we get started with a data visualization consulting project?
Start by scheduling a call with our team to discuss your current data environment, your reporting needs, and the decisions you are trying to make faster. We will assess your data sources, recommend the right data visualization platform for your situation, and propose a scoped engagement with a fixed fee and a 30-day delivery commitment on your first dashboard. Most clients have their first data visualization live within 30 days of kickoff.